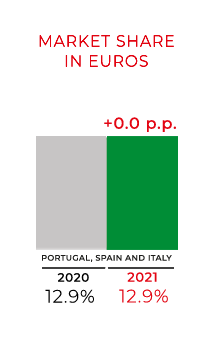
MARKET
SHARE
12.9%
FMCG
(Fast Moving Consumer Goods)
Source: Nielsen
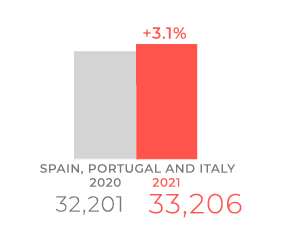
SPAIN, PORTUGAL AND ITALY

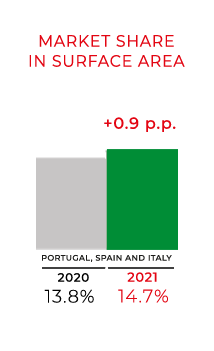
MARKET
SHARE
14.7%
Manufacturers Brands
value participation in
the supermarkets channel
Fuente: Nielsen
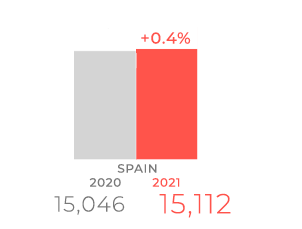
SPAIN
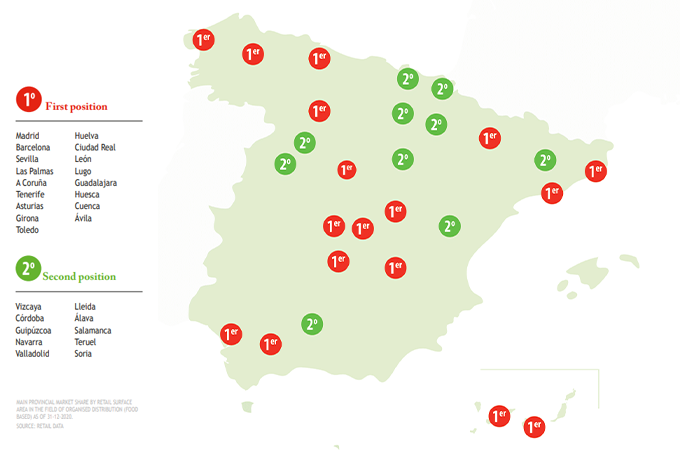
Market share
in surface area
Source: RETAIL DATA
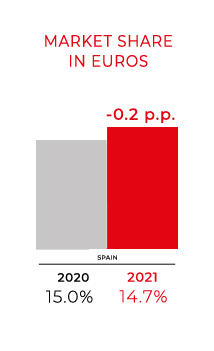
We increased our market share based on value in the supermarkets channel to 19.5% in 2022.
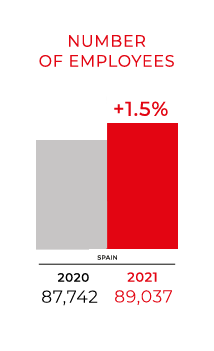
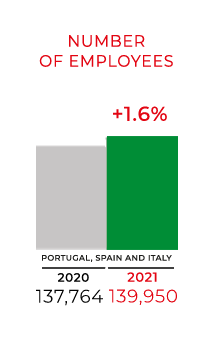
We are one of the country's main employers, creating 1.600 new jobs in 2022, and ending the year with a consolidated base of 90.640 employees.
The market share in the supermarket channel by manufacturer brand – which is one of our distinctive identity features - has raised by 24.2%.
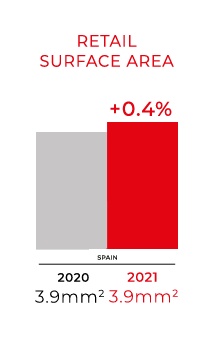
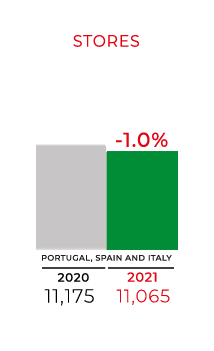
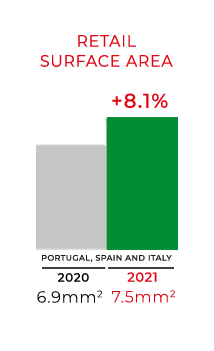
At the year-end date, our national market comprised a network of 6,345 stores over a retail surface area of 4 million square meters.
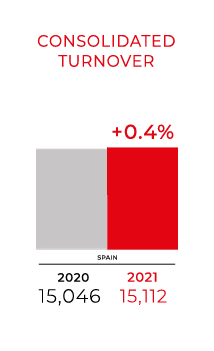
The consistency of our commercial status is reflected by a consolidated income of €16.627 bn, which involves a 10% year on year growth.
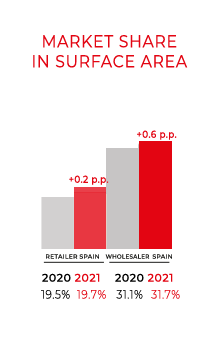
Grupo IFA is the main operator in commercial space in Spain, with a 19.7% share in the retailer channel and 31.2% in the wholesale channel.
The company leads in sales area in 20 provinces and is in second place in 8.

| ASSETS | 2022 | 2021 |
|---|---|---|
| NON CURRENT ASSETS | 3,256 | 3,230 |
| Intangible fixed assets | 458 | 355 |
| Tangible fixed assets | 1,719 | 1,876 |
| Investments in Group companies | 62 | 62 |
| Long-term financial investments | 38 | 41 |
| Tax-deferred assets | 979 | 896 |
| CURRENT ASSETS | 980,426 | 936,467 |
| Inventory | 2 | 28 |
| Trade debtors and other accounts receivable | 980,175 | 902,411 |
| Otros créditos con Administraciones Públicas | 377 | 1 |
| Short-term accruals | 159 | 1,747 |
| Cash and cash equivalents | 90 | 32,281 |
| TOTAL ASSETS | 983,682 | 939,697 |
BALANCE SHEET
AT 31 DECEMBER 2022
In thousands of euros
| NET EQUITY AND LIABILITIES | 2022 | 2021 |
|---|---|---|
| NET EQUITY | 35,914 | 36,540 |
| INTERNAL FUNDS | 35,914 | 36,540 |
| Capital | 1,849 | 1,849 |
| Reserves | 34,959 | 32,958 |
| Group shares | (2,535) | (1,591) |
| Profit | 1,641 | 3,325 |
| NON-CURRENT LIABILITIES | - | 1,250 |
| Long-term debts | - | 100 |
| Long-term accruals | - | 1,150 |
| CURRENT LIABILITIES | 947,768 | 903.157 |
| Short-term provisions | 1,760 | 1,760 |
| Short-term debts | 14,834 | 381 |
| Short-term debt whith Group companies | 50 | 52 |
| Trade creditors and other accounts payable | 930,942 | 899,752 |
| Short-term acruals | 182 | 1,212 |
| TOTAL NET EQUITY AND LIABILITIES | 983,682 | 939,697 |
PROFIT AND LOSS STATEMENT 2022
In thousands of euros
| 2022 | 2021 | |
|---|---|---|
| Net turnover | 1,024.531 | 952,830 |
| Raw materials and consumables | (1,008.868) | (935,909) |
| Personnel expenses | (8,311) | (7,419) |
| Other operating expenses | (4,706) | (4,664) |
| Amortization of fixed assets | (528) | (461) |
| OPERATING RESULT | 2,118 | 4,377 |
| Revenue | 375 | 228 |
| FINANCIAL RESULTS | 102 | 16 |
| PRE-TAX RESULT | 2,220 | 4,393 |
| RESULT FOR THE YEAR | 1,641 | 3,325 |
STATEMENT OF CHANGES IN EQUITY FOR 2022 FY
Statement of recognised income and expense
In thousands of euros
| 2022 | 2021 | |
|---|---|---|
| Result of the profit and loss statement | 1,641 | 3,325 |
| Total revenue and expenses charged directly to the equity | - | - |
| Total transfers to the profit and loss statement | - | - |
| TOTAL RECOGNISED REVENUE AND EXPENSES | 1,641 | 3,325 |
STATEMENT OF CHANGES IN TOTAL EQUITY
In thousands of euros
| Capital | Legal reserve |
Statutory reserve |
Other reserves |
Group shares |
Result for the year |
TOTAL | |
|---|---|---|---|---|---|---|---|
| BALANCE AT START OF 2021 FY | 1,849 | 370 | 4,061 | 26,539 | (1,591) | 3,267 | 34,495 |
| Total recognised revenue and expenses | - | - | - | - | - | 3,325 | 3,325 |
| Operations with shareholders | |||||||
| BALANCE AT END OF 2021 FY | 1,849 | 370 | 4,061 | 28,526 | (1,591) | 3,325 | 36,540 |
| Total recognised revenue and expenses | - | - | - | - | - | 1,641 | 1,641 |
| Operations with shareholders | - | - | - | - | (944) | - | (944) |
| BALANCE AT END OF 2022 FY | 1,849 | 370 | 4,061 | 30,528 | (2,535) | 1,641 | 35,914 |
STATEMENT OF CASH FLOWS FOR 2022 FY
In thousands of euros
| 2022 | 2021 | |
|---|---|---|
| STATEMENT OF CASH FLOWS | (43,885) | (22,413) |
| Result for the year before taxes | 2,220 | 4,393 |
| Adjusted results | 976 | 573 |
| Changes in current capital | (46,047) | (26,290) |
| Other cash flows from operating activities | (1,034) | (1,089) |
| CASH FLOWS FROM INVESTMENT ACTIVITIES | (492) | (588) |
| Payments for investments | (495) | (589) |
| CASH FLOWS FROM FINANCING ACTIVITIES | (12.186) | (7.008) |
| Proceeds and payments for equity instruments | (944) | - |
| Acquisition of own equity instruments | (944) | - |
| Collections and payments for financial liability instruments | 14,453 | (5,728.01) |
| Other debt emissions | 14,553 | (5,528) |
| Repayment and amortisation of bank debt | (100) | (200) |
| Dividend payments and remunerations of other equity instruments | (1,323) | (1,280) |
| Dividends | (1,323) | (1,280) |
| NET INCREASE/DECREASE OF CASH OR CASH EQUIVALENTS | 32,191 | 30,009 |
| Cash or cash equivalents at start of period | 32,281 | 62,290 |
| Cash or cash equivalents at end of period | 90 | 32,281 |
